Solidification Simulation of a Mg-Al alloy under a Given Cooling Rate
Purpose: Learn to perform solidification simulation of a Mg-Al binary alloy under specified solidification conditions using PanSolidification Module. Learn to use the features in PanSolidification Module.
Module: PanSolidification
Thermodynamic and Mobility Database: AlMg_MB.tdb
Kinetic Parameters Database: Mg_Alloys.sdb
Batch file: Example_#5.1.pbfx
Calculation Procedures:
-
Create a workspace and select the PanSolidification module following Pandat User's Guide: Workspace;
-
Load AlMg_MB.tdb through menu "Database → Load TDB or PDB" or by click icon
 , and then select Al and Mg two components;
 -
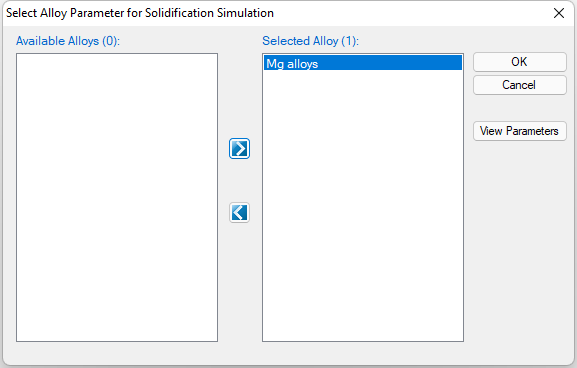
Load SDB file Mg_Alloys.sdb through menu "PanSolidification → Load SDB" or by click icon
 , select the available alloys: Mg alloys, as shown in Figure 1;
 -
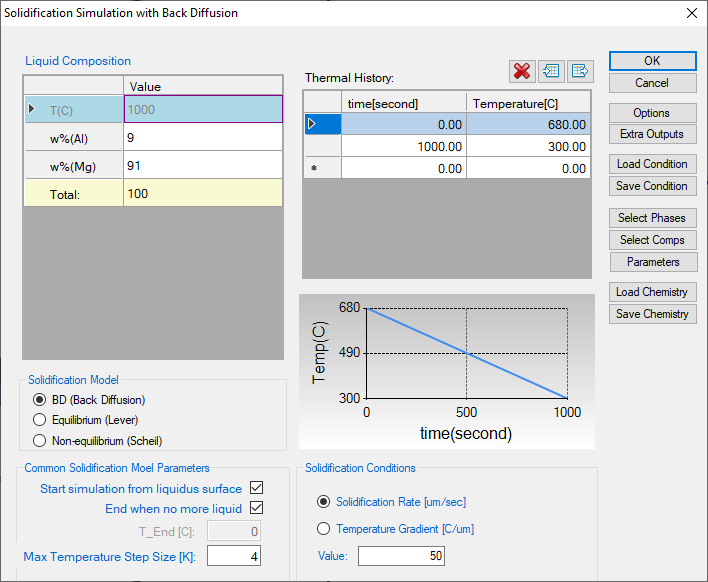
Set Solidification simulation conditions as shown in Figure 2. The alloy composition is Mg-9wt.% Al. The cooling rate is 0.38 K/s is setting in Thermal History solidifying from 680 °C to 300 °C with 1000 second. Solidification rate is set as 50 mm/s. Please pay attention to the units of the time and length when set conditions;
-
Then Click OK to perform Solidification simulation. (Detailed description also in Pandat User's Guide: Tutorial ).
Post Calculation Operation:
-
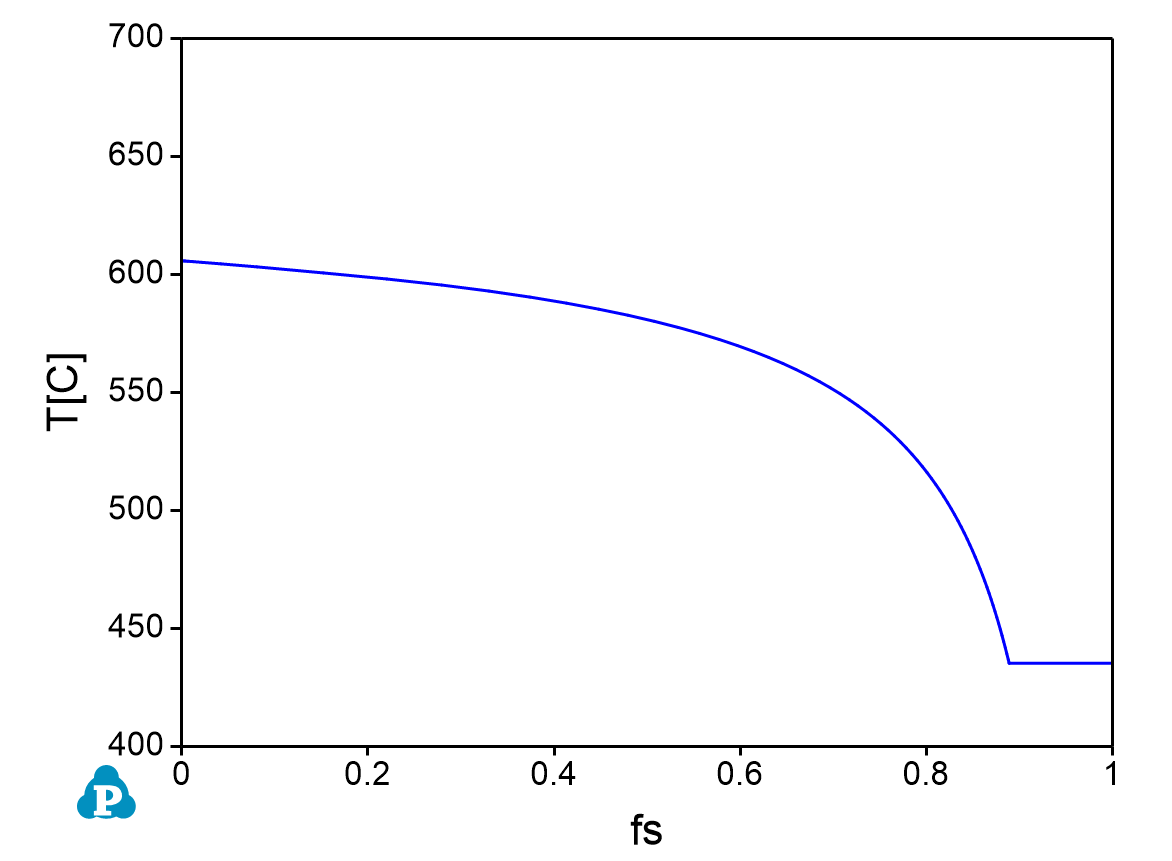
The default plot presents the relationship between fraction of solid (fs) and temperature during solidification as shown in Figure 3.
-
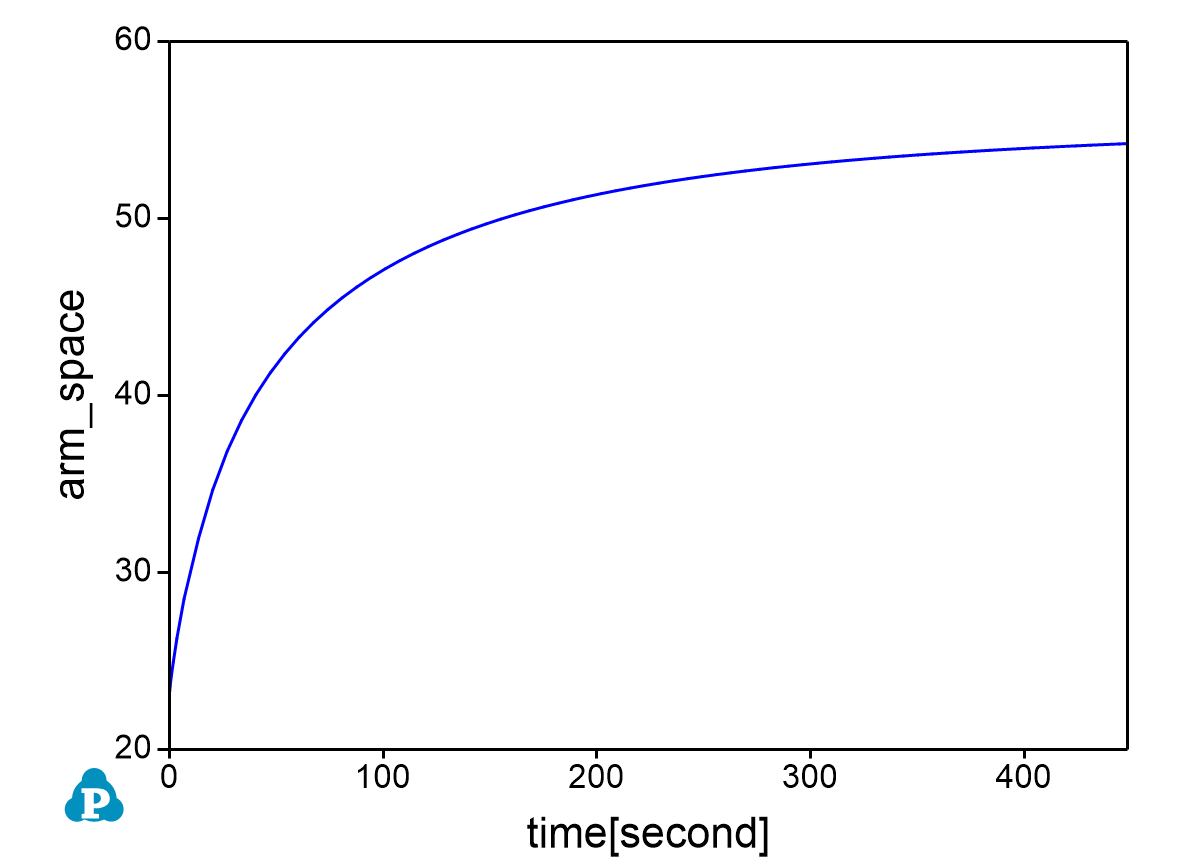
The Default table contains many more calculated results as different columns: such as the secondary dendrite arm spacing (arm_space), the amount of Al12Mg17 phase ( f_tot(@Al12Mg17)) column, and the composition of Al in the solid phase ( w_S(Al)). Users can create other plots from these data.
-
The evolution of secondary dendrite arm spacing during solidification is shown in Figure 4.
-
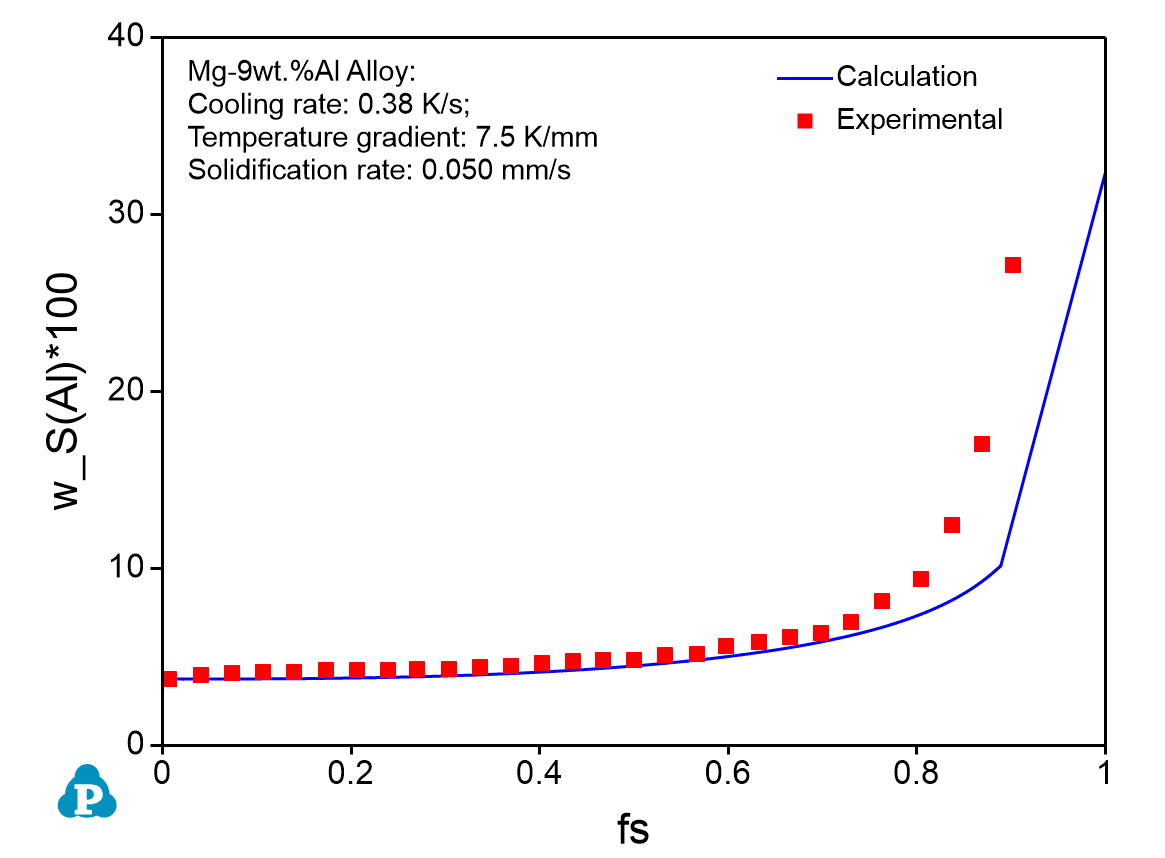
Experimental data can be imported through menu "Table → Import table from File". The comparison of the calculated and experimentally measured Al composition in solid is shown in Figure 5.